
The tools and techniques of data science and advanced analytics can be used to solve many problems. In some cases – self-driving cars, face recognition, machine translation – those technologies make tasks possible that previously were impossible to automate. That is an amazing, transformative accomplishment. But I want to sing a paean to a mundane but important aspect of data science – the ability to intelligently put lists of things in a better order.
For many organizations, once you have found some insights, and are into the realm of putting data products into production, the most substantial value can be found by identifying inefficient processes and making them efficient. Twenty or thirty years ago, that efficiency-gain might have been addressed by converting a paper-based process to a computer-based process. But now, prioritization – putting things in the right order – can be what it takes to make an impact.
In this post I will cover some common ordering problems that organizations face, some of the complexity that can arise, and some thoughts on how to present rankings in user-facing products. Topics include:
- Solving the Right Ordering Problem
- Rank and Predictive Analytics
- Reordering and Optimization
- Presenting Ordered Lists
Throughout, I will return to a few examples: Two classic problems in sales and marketing are simply applications of reordered lists: ranking sales leads and triaging churn risk. If you can predict the likelihood of each of your leads converting, or which of your accounts are least likely to renew their contracts, you can focus your efforts, maximizing bang for the buck. And whether Netflix is recommending TV shows it thinks you might like, or Buzzfeed recommending listicles to you, all recommender systems do is put things in order, in a (hopefully) compelling, personalized way.
Solving the Right Ordering Problem
When ranking sales leads, it makes sense that you want to put the most likely to convert up top. But when recommending things, your goals are less clear. Just putting the items that historically have been clicked on first does not mean you are actually maximizing interactions. If your Netflix-like site puts Adam Sandler movies first, for some reason, then the next time your recommender system tries to learn, it will probably learn that Adam Sandler movies get clicked on a lot. But not because they are great, but just because you previously were presenting them a lot! This sort of bias, where you learn from your own (weak) recommendations, can be hard to notice. Instead of solving the problem “put popular stuff first”, you should be solving the problem “find out what is popular, then put it first.”1Sometimes putting the most-likely-to-be-clicked-on content first is problematic for other reasons; filter bubbles can make people think that the content they like is the only content that exists. In reinforcement learning jargon, you need to balance exploration and exploitation.
My current company, WayUp, also has to think carefully about what problems we are trying to solve. Among other things, WayUp recommends job listings to college students and young professionals, where the goal of the recommendations is to get our users to find great job opportunities, without having to spend a lot of time searching or scrolling. For us, maximizing total clicks probably means we are creating an inefficient experience! A pretty good outcome for us is a user who creates a profile, sees some recommendations, clicks on the first one, applies, gets the job, tells her friends about us, and doesn’t come back (except to maybe read blog posts) for two years. That’s one click. So our goal is not to try to maximize total clicks. Instead, we look at metrics like the proportion of users who apply to any jobs, or the positions in the recommendations list of applied-to jobs.
Rank and Predictive Analytics
Your model for estimating whether a customer will churn probably outputs a probability, but most likely, all that really matters for this task is getting the order right. In fact, the metrics that are commonly used to evaluate categorization models in tasks like this often explicitly ignore absolute predictions and focus on order.
Take a great example that I first learned about from a talk by Drew Conway in 2014 – how the New York City Fire Department (FDNY) uses predictive modeling to focus their inspections on buildings most likely to have a fire. “FireCast, an algorithm that organizes data from five city agencies into approximately 60 risk factors… create(s) lists of buildings that are most vulnerable to fire.” (emphasis added, via GovTech)
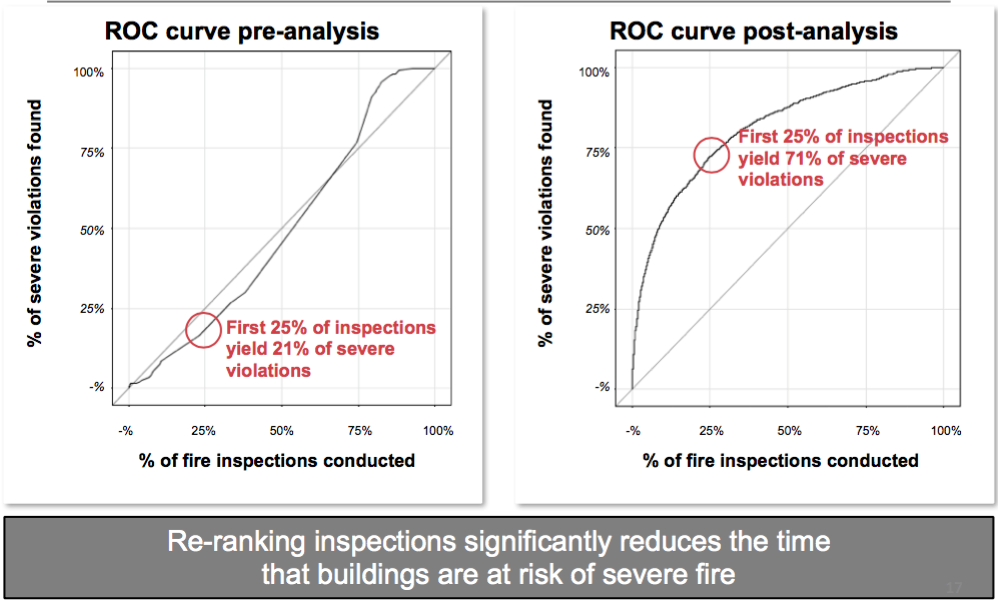
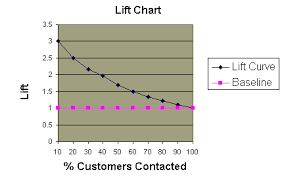
The AUC metric associated with ROC curves like the above can be interpreted as a rank-based metric: “the probability that a classifier will rank a randomly chosen positive instance higher than a randomly chosen negative one.” (via Wikipedia) A similar, and even simpler-to-interpret visualization, the decile-based lift curve, has been used for decades by predictive analytics professionals. Typically, after ordering the test set by likelihood, you divide the list into tenths. For each tenth, you calculate the ratio of the number of positive examples compared to the number you would get if you sorted randomly instead. The ugly lift chart below would tell you that you would be three times more effective if you use a predictive model versus a naive approach. That’s impact!
Reordering and Optimization
The FDNY building-inspection problem can also illustrate the next level of complexity. It may be great that we have a ranked list of locations to inspect, in decreasing risk of fire. But what if that list happened to be ordered such that locations 1, 3, and 5 were on the far West side of town, and locations 2, 4, and 6 were on the far East side? We would waste a great deal of time criss-crossing, which could put buildings at risk longer than they’d need to be, defeating the purpose of our powerful predictive model. Perhaps it would be better to take travel-time into consideration?
This sort of optimization problem has been tackled for many decades by the field of operations research (OR), theoretical computer science, and applied math. A classic example is the traveling salesperson problem, where the goal is to order a list of cities to minimize total travel distance. In the FDNY example, we have a multi-objective optimization problem, where geographic optimization is combined with a ranking problem. If we can estimate a cost on inspecting locations in the wrong order, and a cost on driving, we can numerically optimize the order such that the overall cost is minimized. By using techniques such as integer programming or genetic algorithms, we might find orderings of the property list that lead to inspections of the riskiest properties first, without too much driving.
Presenting Ordered Lists
In the discussions above, I implied that the user is seeing a list – of ranked sales leads, or fire-prone properties, or whatever. But what choices could be made in the visual design of that list, so that users interpret the ranking appropriately and trust that the ranking is relevant?
Merely presenting items in a list may not indicate whether a highly-ranked item is one that has a high likelihood of an outcome (movie you will rank highly; customer who will churn), or one that has a high propensity to benefit from some sort of interaction. These are not the same thing. It is often not very useful to rank something highly if there is nothing you can do about it! If Netflix knows that I would love a movie, but that they don’t have the legal right to show it to me, they won’t recommend it. If customer X is very likely to churn, but I know that nothing I can do will change their mind, is it worth my time to give them a call?
Models that rank items can sometimes provide insight into why a particular item was ranked where it was. For instance, the technique of ensembling a variety of independent models can provide useful information by indicating why particular items were ranked highly. If a recommended item was ranked highly by the Popularity submodel, you can put “Popular!” next to that item. These explanations can help users trust recommendations, both by making clear that the ranking is built from factors that users believe to be causal, as well as by “explaining away” recommendations that may not be useful to them. A churn model that indicates that Customer X is likely to not renew their contract, because we have data that they are going out of business, is trust-worthy even when it is not actionable.
More sophisticated intervention models can sometimes infer causality from data, allowing ranked lists to be based on propensity to benefit. In political marketing, for instance, the goal is not to find voters most likely to vote for a candidate, but instead to find voters whose likelihood of voting the way you prefer is most likely to be changed by an intervention, such as a visit from a canvasser.2Of course, if you use shadily-acquired personality data, and create interventions based on triggering voters’ deepest fears, you have created a different sort of problem.
Final Thoughts
Although the temptation in data science can be to solve the hardest problems using the latest methods, it is often the case that solving simpler problems, like ordering lists better, can be a better use of time and effort. But even that simple problem can be difficult in practice. Solving the right ranking problem, such that people reading the lists interpret them appropriately, can be harder than the actual statistical modeling.
Do you have a great example of reordering lists that led to a real impact to a business or organization? We would love to read about it in the comments!
- 1Sometimes putting the most-likely-to-be-clicked-on content first is problematic for other reasons; filter bubbles can make people think that the content they like is the only content that exists.
- 2Of course, if you use shadily-acquired personality data, and create interventions based on triggering voters’ deepest fears, you have created a different sort of problem.