In part 2 of this series, we learned that every new initiative a team undertakes should be accompanied by an expectation on how the initiative will perform. For example, a Sales team may expect that a new data source will increase the number of new partnerships by 10%. This expectation should be memorialized ahead of time to see how the team fared against their target.
Today, we go deeper on two related KPI concepts: Targets and Forecasts. These concepts are critical to ensuring a successful MBR program. In short, the target for every KPI should be set ahead of time and progress against it should be updated using a forecast, which combines historical performance with future expectations.
KPI targets enable the MBR participants to better understand how the team is progressing against their goals, and a forecast model helps diagnose why. Having these two mechanisms in place ensures accountability and provides transparency into progress at MBR meeting time.
To build a forecasting framework, you need to keep in mind a few key principles. Forecast models could be very simple or very complex, and we’ll highlight some of the differences. Addionforecasts are set from the top-down or bottom-up perspectives. Finally, we’ll highlight when it makes sense to change your targets, and why you should do so sparingly.
Definitions: Targets
A target, established before starting your project, is the goal you’re trying to achieve. The target could be a best estimate or something more ambitious. Targets should not change frequently, but when they do, there should be a good reason. Common reasons for changing targets include structural changes to your business (e.g. you unexpectedly landed or didn’t land a huge client) or unforeseeable exogenous factors (e.g. a global pandemic). Some targets are year long and very high level (e.g. an annual revenue target), and may be called “annual plans”.
Targets are used to set expectations across the organization, align everyone on the same objective and provide something to measure success against.
Definitions: Forecasts
A forecast is a projection of the current state of your business into the future. Forecasts help to understand how you’re performing against the target at any point in time during the course of a project.
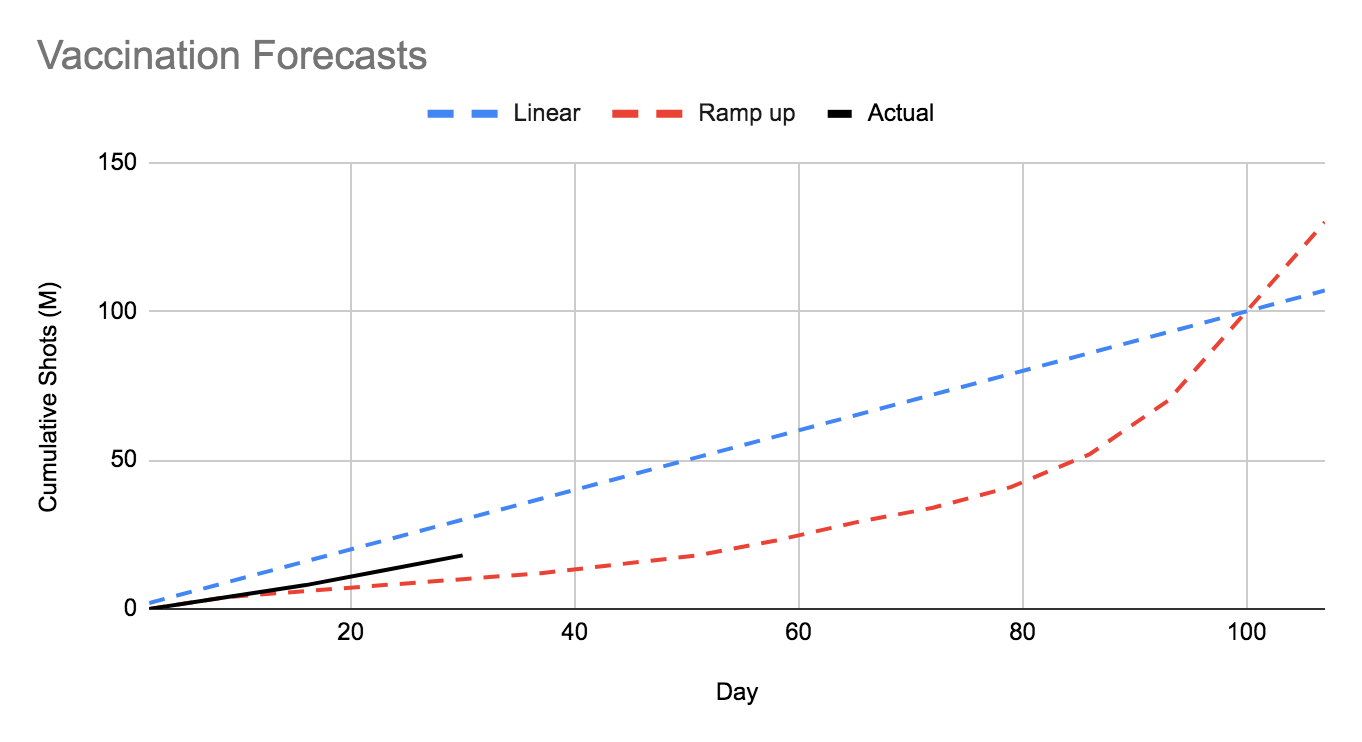
For example, if we set a goal of 100M vaccine shots in 100 days, and we’ve administered 18M shots after 30 days, we’d like to know if we’re ahead or behind our target. We can go about this in two ways:
- At day 30, we make a projection of how many shots we expect to have at day 100, given what we’ve observed so far (18M shots) and what we expect to get over the remaining 70 days, given our forecast curve.
- Using our original target curve (equivalent to a “day 0 forecast”), calculate where we expected to be as of day 30 to determine if 18M shots is ahead or behind that original expectation.
Simple vs. complicated models
Our forecast curves may be simple, e.g. draw a straight line from day 0 to day 100, or complicated, e.g. start slow and ramp up faster over time. In our straight-line model, our Day 30 forecast has us at 30M shots by day 30 (1M shots per day). Using this model, our actual 18M shots is well below target for day 30.
However, it’s reasonable to assume that as we work out inefficiencies early on in the vaccination program, we’ll administer shots faster and faster. This suggests a “ramp-up” model may be more realistic than a straight line model, which means that 18M shots by day 30 isn’t obviously bad, depending on what the ramp-up curve looks like*.
For many business use cases, simple linear forecasts are sufficient, even if they aren’t extremely accurate. For example, if your KPI is # of clients closed by the end of the quarter, it’s reasonable for your forecast to assume ⅓ of the target each month as a rough gauge of progress.
Other KPIs, for example the number of users acquired after a product launch, will likely increase slowly at first and then after marketing and referrals kick in, increase faster, until you reach a market saturation point, and new customer growth slows down (an S-curve). In this case, in order to assess if you’re ahead or behind at a given point in time, you’ll want a forecast model that takes into account the market size, speed of ramp-up, competition, adoption rate, seasonality of the business, etc…
Don’t Overcomplicate
A word of caution: it’s easy to over complicate your forecast models because modeling the world accurately is…hard. To avoid overcomplicating your models, consider:
- If you have enough data to support the increased complexity
- The more parameters you add, the more data you’ll need to fit your model
- If the decisions you make with respect to the model’s outputs are meaningful
- Getting 1% increased accuracy is helpful when tuning a recommendation engine that is used by millions of people a day. However, for the purposes of tracking business KPIs, it probably won’t lead to a different decision
- The time horizon
- In general, the shorter the forecast period, the less value added complexity provides. And the longer the forecast, the more likely unexpected things will happen, rendering your added complexity less fruitful. This will vary depending on how volatile your business is.
- The confidence in your projection
- A best practice is to communicate your confidence level — not necessarily in the statistical sense, moreso to help folks understand the context of the projection. Your confidence will vary by the amount of data you have, the time horizon, the inherent variability in your business, domain expertise available and a host of other things. In general, the more complicated your model, the more likely its output is sensitive with respect to changes in its features, reducing how much you should believe the output of any given run.
Bottoms up vs. Top down
A baseline set of assumptions is critical to any target setting process. Broadly, targets are set either in a bottoms-up or top-down approach.
Bottoms up
A bottoms-up approach uses a number of assumptions, makes relationships explicit and likely involves a complex formula. This approach is often more rigorous or scientific than top-down. If you ask a public health official to set a target for the number of vaccinations, they may consider the speed of distribution per day, the number of patients likely to get vaccinated, the vaccination protocol, the number of staff available per week, etc… and they’ll arrive at some target. With the model in hand, they can tweak the various assumptions to get different targets as needed (e.g. how many staff do we need to hire to hit the 100M in 100 days?)
Top down
A top-down target setting process, on the other hand, is based on company targets or executive decisions that are made without necessarily tying in to what’s happening “on the ground”. Top-down targets require business teams to reverse engineer the assumptions needed to hit the target, so they know what they’re optimizing for, in lieu of an explicit formula. An example of top-down is “100M shots in 100 days”. It may or may not be grounded in reality, but the public health community will reverse engineer what is required for this to be true and work towards those lower level goals. The hope is that it’s not completely out of reach (but sometimes this happens). When this is the case, the executives in the organization may either re-consider their target or offer “executive signoff” type solutions that the business teams may not consider, for example, hire more staff, re-prioritize initiatives, etc…
Regardless of top-down or bottom-up, every target needs to be seeded with a baseline set of assumptions. For “100M in 100 days” to be true, at day 0, we need to seed our model, such that when our forecast model makes its projection, it can hit 100M shots in 100 days. Note that even if you have top-down target, you’ll need a bottoms-up model for forecasting (even if the model is a straight line from 0 to the target). Initially, set your inputs so that it projects the target, and over time you’ll update your inputs to revise your forecast.
To recap, your KPIs need to have targets, a set of baseline assumptions and a forecast model that, given those assumptions, can get to the target. Then over time, as data rolls in, update your initial set of assumptions with real data, and re-forecast. Each time you forecast you’ll know if you’re ahead or behind target.
Moving the goalposts
As data rolls in, you’ll quickly get a sense for how realistic your initial assumptions were. If your model assumed vaccinating 18M people in 30 days, but in reality you only vaccinated 5M people, then it’s reasonable to consider changing your vaccination strategy or target (if it’s warranted).
A prescriptive and reliable forecast model helps tremendously in informing business strategy. If your forecast model indicates that you are underperforming in some area against expectations (say you aren’t distributing vaccines to the states at the level you initially expected), then you can interrogate why and develop plans to improve. If your model is unreliable, or isn’t granular enough to identify where you’re underperforming (because you didn’t make this input explicit in your formula), then the model may tell you what’s happening (vaccinations are lower than expected), but not why. This is a purely descriptive model, which is of less value than the prescriptive one.
In either case, especially when you’re forecasting something that is hard to forecast, there are times when you need to reconsider the initial target. As mentioned above, you don’t want to get in the habit of changing targets too frequently or you risk losing credibility with your business teams. However, if the target is unrealistic and it’s setting your business partners up for failure, then consider changing it. As a best practice, when setting initial targets, be clear about what may cause the target to be changed and when you’ll know it, so at least you can anticipate this and make a game plan. You’ll also gain credibility from stakeholders because you’ve identified how the model can go wrong ahead of time.
Conclusion
Forecast models for KPIs give you and your business partners the ability to understand if you’re ahead or behind target at any point in time. Depending on the nature of the forecast you may be able to identify underperforming areas that you can highlight and prioritize improving.
Targets are set ahead of time, and depending on the nature of the business, could be wildly off. You should reset targets on regular business intervals (quarter, year) and whenever there are structural changes to the environment that render the original targets meaningless, but avoid doing this too frequently.
Targets and forecasts are excellent tools in communicating progress, developing action items and holding folks accountable in the MBR.
How do you think about setting targets and building forecast models for KPIs? Let me know in the Slack!