Executive Summary
We want our work to be impactful and used by stakeholders; we keep hearing that developing data products is the answer. Here’s a step-by-step guide on how to get there.
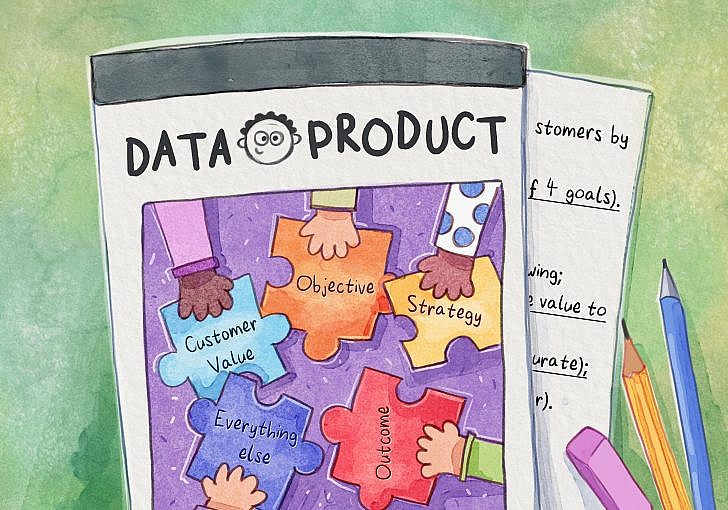
Successful data products help our collaborators decide how to improve the company’s health. To do so, before any development starts, we first need to have a shared understanding of the context around: why something needs to happen (e.g., our objective), what specifically needs to happen (e.g., our outcome), as well as by whom and how (e.g., our strategy). This information will then help everyone get on the same page, and identify concrete steps to move the needle in one specific way to help the company grow.
Many Data Requests Fall Short
We’ve all been there:
- We did a great job coming up with the best answer… to the wrong question.
- We worked really hard to deliver results, but they didn’t get used.
- We keep hearing that we need to develop data products, but we’re not sure what that means or how to go about it, so the work does get used and has a significant impact.
- Our resumes focus on tasks and tools, rather than the “how” and “why” they were used/needed.
- We get inundated with “quick questions” and “simple requests” that don’t connect to the bigger picture, leaving us frustrated as we fall down rabbit holes.
- Our team seems to be a “cost center.”
Let’s avoid coming up with the best answer… to the wrong question!
We want to avoid these scenarios by investing time up-front in learning the context around the company’s goals and growth strategy and how to connect it to each request to develop impactful data products. This blog post outlines a framework for doing so, which will help us navigate discussions with collaborators1 I’ll avoid calling our collaborators stakeholders, following Johanna Rothman’s convention, and assume that our company is for-profit. Three resources on the topic of stakeholder management are my blog post on the “`Dark Arts’ of Stakeholder Management,” Jerrie and Niko’s advice on “Stakeholder Engagement Best Practices,” and the book on navigating difficult conversations., share expertise, and build credibility.
By filling out2We can treat this template in one of 3 ways: (1) as a mental model for ourselves; (2) as a template to fill out as we meet with the collaborator; (3) as part of an intake form for the collaborator to fill out, because if they’re too busy to fill out the template, then the request isn’t a high priority. As a side effect, by filling out this template for every request (even if we DIY), we’ll be able to keep track of needs across the company, which may help inform future strategy. the “discovery phase” template introduced below as a mission statement for the project, we’ll learn the backstory of “why this request, why now,” which will help us and our collaborators align more quickly around scope3The template can also help us navigate the discussions around scope, because it will help us uncover what’s most important to the collaborator, e.g., which 2 of the “project management triangle” sides are most important? Do they need the deliverable to be full-featured or a proof-of-concept, fast or very accurate, or all hands on deck vs. staffed when the bandwidth becomes available? Discussing that the answer affects the priority of the request and that a deliverable scoped down to a proof-of-concept (e.g., the smallest experiment to learn from) will help us more quickly learn about our customers, iterate, and get on the same page – also helps with buy-in., objectives and priorities before moving forward with any request. This way, the result of completing the template will be: either an outline of a data product that can create value for the organization that we can begin implementing, or a backlog of the request until the template is complete and reprioritized above everything else.
Whether we’re just starting as a data practitioner, are on a Data Team, are a team of one, or are a senior leader managing a large team, this discovery phase will help us (the “Data Team”) pivot from reactive to proactive insights, deliver higher impact work in less time, and strengthen the partnership with our collaborators.
Discovery Phase Template
Without further ado, here’s the template to help us uncover the business question, capture the context around each request, and guide us on delivering an actionable data product; the rest of the article will dive deeper into what this all means.
1. Customer Value
Company's mission is to help internal/external customers by creating (value).

2. Objective
To grow the company, we can (1 of 4 company goals).

3. Strategy
To achieve the objective, we will do the following:
  a. decrease/increase (1+ of 14 levers),
  b. summarized by (metric);
  c. (process of pulling lever to add customer value),
  d. with an (approximate or accurate) recommendation;
  e. (partners implementing process of pulling lever).

4. Outcome
Implementing the strategy above should result in:
  a. company growth of size (size),
  b. over the next (timeframe),
  c. with a deadline of (timeframe).

5. Additional Context
Is there anything else we should know?
This template looks like a lot of work up-front, but it will help us have a shared vocabulary with our collaborator to really understand the business question.
We’ll walk through an example of a request that originally only included an ask for a “customers’ lifetime value (LTV) calculation.” We’ll show how to uncover key points to identify what the collaborator is actually trying to do and why. We’ll assume that we’re at DataWise Insights LLC, a hypothetical software-as-a-service (SaaS) company selling a productivity product (such as Calendly, Zapier, or Hubspot) to individuals, which has a freemium base and a “pro” tier. The “pro” tier has additional features that customers can use if they pay us a monthly subscription at $10/month, billed at the beginning of the month.
1. Customer Value
Company's mission is to help internal/external customers by creating (value).Customer value is the perceived benefit that a company provides to its customers4Internal customers are collaborators inside the company, such as employees on another team (e.g., Marketing customers when we’re on the Data Team, or the Data Analytics Team when we’re on a Data Engineering Team); external customers are those that are outside the company, such as customers paying for the company’s products/services.. It’s the primary purpose of why the company exists, how it makes money, and why customers buy its product/service.
Customers will buy and use a product/service again and again only if it brings them value. This customer behavior is what a company wants to identify, nurture, and retain because its power users make the most money for the company.5Companies that bring customer value in more ways than one tend to have more customer loyalty.
Understanding the ideal customers the company serves and identifying how it benefits them is the first critical piece of context around why we’re getting a request in the first place.
A company may be selling products/services directly to its customers (e.g., direct-to-consumer, shortened to D2C or DTC) or by selling to other companies that sell to its customers (e.g., business-to-business, shortened to B2B). Customers of D2C and B2B companies need motivation beyond the product’s price to make a purchase. A direct-to-consumer company can bring value in 1+ of 30 ways by addressing consumer needs, including social impact, life changes, emotions (such as feelings of accomplishment), and functionality. A company in the business-to-business space can bring value in 1+ of 40 ways, including inspiration, individualization, ease of doing business, functionality, and table stakes.
Even if it looks like we’re not in the D2C/B2B space, this can help us determine what value we bring to the company, our colleagues, and external customers! For example:
- A department that’s a shared resource across the company, such as a Platform Engineering, Data Engineering, or a Legal team, is solving customer pain points for internal customers in many areas of the “functional” tier mentioned in the D2C space, such as reducing effort, improving quality, and reducing risk.
- Suppose the company is in the healthcare space. In that case, it typically aims to improve the quality and/or access to care, along with many areas of the “ease of doing business” tier mentioned in the B2B space, including increasing the hospital’s reputation and national rankings as part of its value in commitment and expertise.
The data product’s goal is to deliver more/better customer value and improve the company’s health.
The data product’s goal is to deliver more/better customer value and improve the company’s health.
Example: At DataWise Insights LLC,
1. The company’s mission is to help our customers save time.
Please note: If the company solves 1 customer pain point for its external customers, or the team is a shared resource solving 1 internal customer pain point, the answer to how the company brings value to its customers will always be the same across requests.
2. Objective
To grow the company, we can (1 of 4 company goals).An objective is the problem we’re trying to solve, which is also the shared end goal6A goal shared with our collaborator means that we’re one team, working together on this request towards the same objective, and we succeed as a team only if we can partner to get there. Having shared goals also helps when having difficult conversations. of the collaboration and the data product, shared between the requester and the Data Team.
At for-profit companies, that objective is synonymous with growth. A company typically grows in 1 of 4 ways, by:
- increasing revenue,
- increasing efficiency,
- reducing risk (for instance, of a cyber attack), and/or
- improving quality (for example, of data or patient care).
By confirming which of these 4 options is the end goal of the data product, we’re not only using easy-to-understand terms that specify precisely how we’ll help our collaborators and the company improve its short- and/or long-term health; we’re also building rapport and positioning ourselves as a partner in the collaboration.
Example: At DataWise Insights LLC,
2. Our company will grow if we can increase revenue next quarter.
We can now work backward from our objective to outline what we need to do to get there, before we dive into any development.
3. Strategy
To achieve the objective, we will do the following:
  a. decrease/increase (1+ of 14 levers),
  b. summarized by (metric);
  c. (process of pulling lever to add customer value),
  d. with an (approximate or accurate) recommendation;
  e. (partners implementing process of pulling lever).
A strategy is a high-level plan (or a series of steps) outlining how we’re proposing7Because customers’ preferences may change, there may be a bug in the data collection, or something else may happen when our data product goes live, we can never guarantee the plan’s performance. to reach our objective.
3a. Which Lever to Pull
There are different ways to drive company growth. Phil Libin, venture capitalist and co-founder and CEO of Evernote, introduced the idea that what’s going on in every company can be summarized by this chart and its 14 lines8The number of lines/levers can vary depending on the company’s offering and pricing structure. For instance, companies that are (1) marketplaces can have one chart to summarize the demand and another for the supply, to help optimize customer journeys for each of these two different sets of customers; (2) products or services with hardware components can have an additional chart capturing the hardware supply chain, to help evaluate if there are things to optimize there; (3) hiring can adapt this chart to summarize and improve each step of the pipeline: from candidate sourcing to internal referrals, to hiring, onboarding, and retention., describing the customer types/states and the transitions between them:
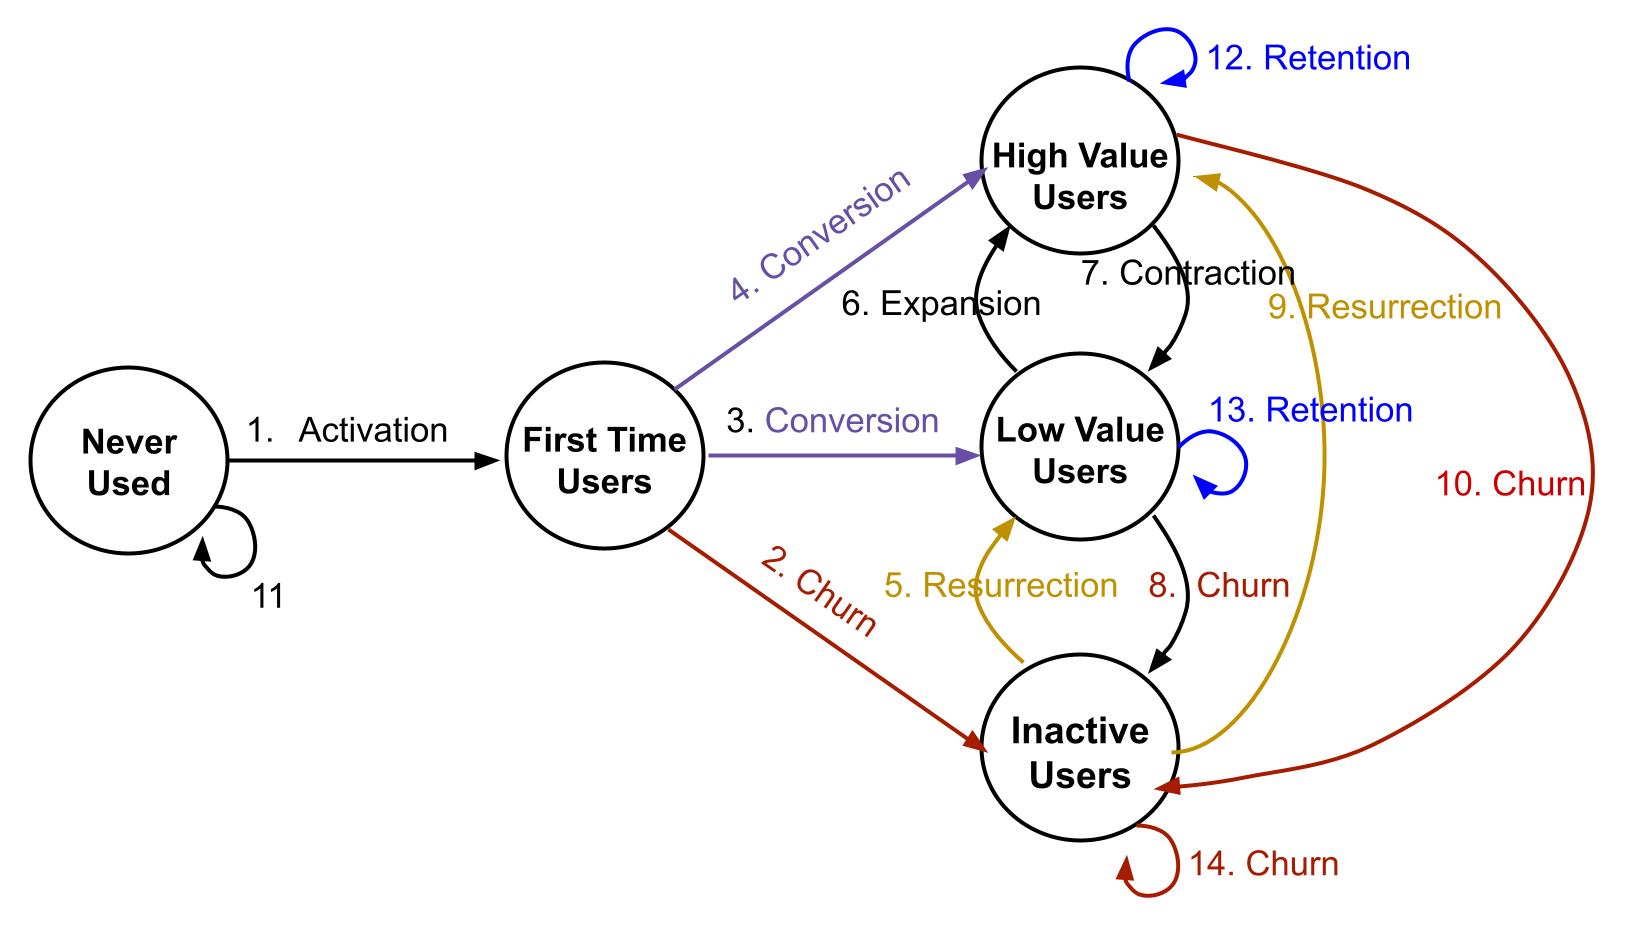
With the help of this chart, we can see a limited number of ways to improve our company’s traction. Here are 5 ways to approach the discussion around strategy with our collaborator, to share context as well as to identify and define what we’re trying to achieve9One side effect of using this chart is that it should cut down on the number of circular requests we’ll get, because we’ll have more clarity around what end goals we’re striving for, even if nothing else is clear. Another side effect is that it can help us reframe an unsupervised problem into a supervised problem, making it much easier to validate.:
- We can agree that high-value customers becoming inactive (line 10) is the highest priority to fix because it’s typically cheaper for a company to retain its existing customers than to find new ones of the same caliber.
- Another tactical approach is to work backward from a quarterly company/board/team metric and tie the request and 1+ of the 14 levers into it.10Don’t forget to offer to discuss the context of how we’ve reached the suggestion(s) to help guide collaborators in their decision-making process. This approach will make everyone look good!
- Then, there’s always the process of elimination, discussing the unique ways to help the company gain more traction, including:
- increasing activation of first-time users (line 1),
- decreasing churn of first-time users becoming inactive (line 2), low-value users becoming inactive (line 8), high-value users becoming inactive (line 10), and/or inactive users staying inactive (line 14),
- decreasing contraction of high-value users becoming low-value users (line 7),
- increasing conversion of first-time users into low- and/or high-value users (line 3 and/or 4),
- increasing expansion of low-value users into high-value users (line 6),
- increasing resurrection of inactive into low- and/or high-value users (line 5 and/or 9), and
- increasing retention for low- and/or high-value users (line 13 and/or 12).
- Alternatively, we can discuss the definitions for each of the states and what the flow of customers between those states looks like, to figure out which may improve traction and best capture what success means for our collaborator.
- Bonus: If we’re trying to be more proactive, what does this chart and the flow numbers between the states look like at the company? Where’s the company doing well? What can be improved – and should be a request? Consider recommending that; it just might become the next Product-Led Growth (PLG) or Product-Led Sales (PLS) motion!
Example: At DataWise Insights, LLC,
3. One way to increase revenue next quarter, with this request, is to try to:
- decrease the churn of our highest-valued customers that pay for the “pro” tier (line 10).
3b. Metric
A metric will help us evaluate if how we’re pulling levers brings our customers more value; it summarises what’s working or not and what success can look like. Typical metrics for the levers are: profit, percentage, and the time it takes to get to the next state in the chart.11For example, potential metrics to summarize the expansion of low-valued users into high-valued users (line 6) can include: the additional profit from the expansion, the percentage of those that convert, the average time it takes for those that convert to do so, or the average time it takes to get back the customer acquisition costs (CAC) for those that convert.
3 of the most common ways to identify the metric12If we get started calculating the metric, but find that the data is missing or the quality poor, this will motivate the discussion with our collaborator on what’s higher impact and priority than the current request that we can try instead. are:
- If, when deciding on which lever to pull, we started with the end goal of a company/board/team metric in mind, that’s the metric to use here.
- Process of elimination, choosing between profit, percentage, and time-to-event of the lever(s) we’ll be trying to pull.
- Asking the collaborator to confirm/walk us through what metric(s) they had in mind.
Example: At DataWise Insights, LLC,
3. One way to increase revenue next quarter, with this request, is to try to:
- decrease the churn of our highest-valued customers that pay for the “pro” tier (line 10);
- summarized by the churn rate of the newly upgraded “pro” users, which we will try to reduce by 5%.
3c. Process of How to Pull Lever
We’ve just settled on which lever to pull to help the company grow and which metric will capture whether we’re successful in driving growth. Next, we’ll write out what specific actions/steps we actually need to take to: pull and move the lever and the associated metric, bring our customers more value, and try to get us to the desired objective.
Identifying these steps is the key to delivering an actionable data product! We’ll do this in two parts:
- First, we need to understand what’s working for our customers now;
- Then, figure out how specifically we can embed into that workflow as a proof-of-concept intervention that will benefit the customers even more.
Here’s how to get there.
Understanding Current Customer Habits
We need to understand (at a high level) how customers are getting value from our product/service now so that the resulting data product becomes an intervention that directly plugs into how our customers already do things when we pull the lever to bring them more value. In turn, we won’t adversely affect our customers’ habits with our data product and make adoption easier for everyone, customers and company included.
3 of the most common ways to understand how our customers currently get benefits from the company’s products are:
- By trying out the product/service ourselves;
- If that’s not possible, see if we can shadow someone who is close to customers and understands their pain points, which may include (depending on the company) Support, Account Managers, Sales Representatives, and/or Product Managers;
- If that doesn’t work or is not accessible, ask the collaborator to:
- walk through the customer workflows and,
- share how they see themselves actually using13In discussions, we can ask the collaborator directly (“what they had in mind”) or indirectly (“if, for example, our metric will be ‘3’ – “what will it tell you? how do you see yourself using it?”) to get a better idea of what they’re looking for — and how that plugs into current customer workflows. the metric to decide whether we’ve reached the objective once the data product is live.
Because “data projects are uncertain,” these discussions can uncover that we need to modify the strategy we’ve just outlined to bring our customers more value. Improving our strategy while keeping the objective the same just made our data product more actionable!
Example: At DataWise Insights LLC,
To reduce churn, we’ll focus on those customers who want to be even more productive, having just upgraded to “pro,” but haven’t used any of the “pro” features they’ve paid for yet.
Recommended Actions Tied to Current Customer Habits
Armed with this knowledge, let’s discuss with the collaborator how specifically the deliverable will integrate end-to-end into the customer habits we’ve identified – with minimal disruption to those habits and with more benefits – in a way that will also help the company grow.
Example: At DataWise Insights, LLC,
3. One way to increase revenue next quarter, with this request, is to try to:
- decrease the churn of our highest-valued customers that pay for the “pro” tier (line 10);
- summarized by the churn rate of the newly upgraded “pro” users, which we will try to reduce by 5%.
- When a customer upgrades to “pro” and has not used any of the “pro” features they’ve been paying for within the first 2 weeks of the upgrade, email them 1 week before their first monthly renewal is due with a tip on how to use the most popular “pro” feature.
The email tip will save the customers more time and help them reconsider canceling their monthly subscriptions. We’ve just identified which actions will power the data product!
3d. Approximate or Accurate Recommendation
It’s not always the case that our collaborator always needs the most accurate answer; sometimes, a directionally correct answer we can get to our collaborator faster will be just as valuable. Otherwise, if we don’t ask about this, we may spend more time than needed on our investigation.
For example, say our data product is trying to upsell our existing customers on a new feature; on the first day the data product went live, the number of upsells stayed about the same. This approximate trend suggests that the data product may have a bug, our data collection or customers’ preferences changed, or something else is going on.
Example: At DataWise Insights, LLC,
3. One way to increase revenue next quarter, with this request, is to try to:
- decrease the churn of our highest-valued customers that pay for the “pro” tier (line 10);
- summarized by the churn rate of the newly upgraded “pro” users, which we will try to reduce by 5%.
- When a customer upgrades to “pro” and has not used any of the “pro” features they’ve been paying for within the first 2 weeks of the upgrade, email them 1 week before their first monthly renewal is due with a tip on how to use the most popular “pro” feature,
- with an accurate recommendation, because we need to know who will receive the email.
3e. Partners Implementing Process of How to Pull Lever
Data Teams can’t deliver data products in a vacuum. Who are all the partners that need to be involved – and how14To ensure that the right collaborators are involved, this may also be a great time to use the DACI decision-making framework to identify who’s the Driver, Approver, Contributor, and who needs to be Informed of the progress on this request., to get us to try to move the levers in practice?
Example: At DataWise Insights, LLC,
3. One way to increase revenue next quarter, with this request, is to try to:
- decrease the churn of our highest-valued customers that pay for the “pro” tier (line 10);
- summarized by the churn rate of the newly upgraded “pro” users, which we will try to reduce by 5%.
- When a customer upgrades to “pro” and has not used any of the “pro” features they’ve been paying for within the first 2 weeks of the upgrade, email them 1 week before their first monthly renewal is due with a tip on how to use the most popular “pro” feature,
- with an accurate recommendation, because we need to know who will receive the email.
- To get there:
- The Data Team will:
- Confirm with the website, a Product or Sales Team, or another department, which product features fall into the “pro” tier.
- Identify the most popular feature that “pro” customers paid for and used over the last 30 days.
- Create a list of all the customers that have upgraded to “pro” within the last 2 weeks and have not used any of the “pro” features.
- Share the list of customers with the Marketing Team.
- The Marketing Team will:
- Collaborate with Docs or Developer Advocate Team (or similar, if it exists), or create content about how to use the most popular feature that “pro” customers paid for and used over the last 30 days.
- Draft an email that will go out to the list of customers about the most popular “pro” feature.
- Email the list of customers 1 week before their first monthly renewal is due.
- Monitor these customers for:
- Usage of the most popular “pro” tier feature, and
- Rate of these customers canceling their “pro” subscription within 1 month of upgrade.
- The Data Team will:
By writing this out, we’ve identified another metric to monitor! And it’s now clear who’s responsible for what. If even one of the partners doesn’t have the bandwidth, this prompts a discussion around impact, scope, objective, strategy, priorities, and deadlines – or the request is blocked and becomes a candidate for the backlog.
4. Outcome
Implementing the strategy above should result in:
  a. company growth of size (size),
  b. over the next (timeframe),
  c. with a deadline of (timeframe).
An outcome is the impact of the data product deliverable; it’s specific, measurable, and time-bound.
4a. Size of Impact on Company Growth
Common ways to measure the impact of a request include the amount of money, percentage, or magnitude.
When we say ‘yes’ to something, we say ‘no’ to something else. For this reason, the team lead can decide that to better juggle the company and team priorities for next quarter – along with the long-term roadmap and ad-hoc requests, only very high-impact asks may be re-prioritized against all other goals – and everything else will be backlogged.15This is because the team’s roadmap (if it exists) gets the highest priority. Typically, it results from priorities negotiated and aligned across departments and with executive input. To help push back on a low-priority request: share the prioritized roadmap with the requester, mention that executives prioritized it across the company, and let them know that the request has been added to the backlog and is a candidate for next quarter’s prioritization.
There are 2 ways we can try to quantify what “very high” impact means: approximate ($50K) or relative (t-shirt size16Asana has a great resource on how to get started on estimating and using t-shirt sizing. Large or X-Large).17Consider asking the collaborator for these rough details and estimates to prevent the scenario of everyone filling in “XL” to inflate the priority of the request artificially.
Example: At DataWise Insights LLC,
4. Implementing the strategy above should result in:
- [Approximate] Company growth of size $50K:
- 5% churn is about 1K customers;
- Typically, if our customers stay beyond the first month, they stay for at least 6 months. With our email tip, we expect to generate an additional $50/customer, or $50K, over the next 5 months.
- [Relative] Company growth of size XL:
- We expect this request to be of relatively high impact and low effort: we think it will take less than 1 week to identify which customers to send the email to and for the Marketing team to draft and send the emails, which should prompt more renewals to go through within the week, resulting in higher revenues almost immediately.
4b and 4c. Time Frames
There are 2 timeframes we have to consider when prioritizing a request:
- The deadline to deliver the data product; and
- The timeline by which we expect to see the effect of the deliverable or a return on investment (ROI).
Example: At DataWise Insights LLC,
4. Implementing the strategy above should result in:
- company growth of size XL,
- over the next 6 months,
- with a deadline of 1 week.
Notice that if the deadline is not feasible, this will prompt another discussion around impact, scope, objective, strategy, priorities, and backlog.
5. Request for Additional Context
Is there anything else we should know?Adding space in the template for additional information will also help get everyone on the same page faster. It may help us learn that we’ve tried answering this question before, that it relates to a bug in a dashboard, that it’s a blocker to doing something critical, or that it’s something else entirely. Leaving space for additional context also signals to the collaborator that we know they’re the expert on the request, and we’d like to learn as much as possible to help the collaboration succeed, avoid re-doing work, and build on previous findings (if those exist) instead.
Example: At DataWise Insights LLC,
5. We collaborated with Irene 6 months ago and couldn’t answer this question. We didn’t know which features were associated with the free vs. paid tiers – or when the upgrades happened. The Engineering team set up the data capture for this earlier this month.
What a way to bury the lede! This additional information tells us that there are a lot more unknowns than expected, as it’s now not clear:
- what features are associated with the free vs. paid tier – and how long that may take to iron out;
- even if the features are known (or won’t take too long to identify), we also don’t know if the data collection is working as expected; and
- even if it is, we haven’t had any churned customers in the last month since the data collection is so recent;
- and we haven’t monitored metrics around usage and cancellations before.
Notice that this also helps us discuss scope and priorities with our collaborator because, given what we do and don’t know now, the 1-week turnaround deadline is unrealistic.
Putting it All Together: Template for Request for LTV Calculation
At DataWise Insights LLC, the original request was: “We need the customers’ lifetime value (LTV) calculation.”
The same request, using the discovery template, now looks like this:
1. The company’s mission is to help our customers save time.
2. Our company grows if we can increase revenue for next quarter.
3. One way to increase revenue next quarter, with this request, is to try to:
- decrease the churn of our highest-valued customers that pay for the “pro” tier (line 10);
- summarized by the churn rate of the newly upgraded “pro” users, which we will try to reduce by 5%.
- When a customer upgrades to “pro” and has not used any of the “pro” features they’ve been paying for within the first 2 weeks of the upgrade, email them 1 week before their first monthly renewal is due with a tip on how to use the most popular “pro” feature,
- with an accurate recommendation, because we need to know who will receive the email.
- To get there:
- The Data Team will:
- Confirm with the website, a Product or Sales Team, or another department, which product features fall into the “pro” tier.
- Identify the most popular feature that “pro” customers paid for and used over the last 30 days.
- Create a list of all the customers that have upgraded to “pro” within the last 2 weeks and have not used any of the “pro” features.
- Share the list of customers with the Marketing Team.
- The Marketing Team will:
- Collaborate with Docs or Developer Advocate Team (or similar, if it exists) or create content about how to use the most popular feature that “pro” customers paid for and used over the last 30 days.
- Draft an email that will go out to the list of customers about the most popular “pro” feature.
- Email the list of customers 1 week before their first monthly renewal is due.
- Monitor these customers for:
- Usage of the most popular “pro” tier feature, and
- Rate of these customers canceling their “pro” subscription within 1 month of upgrade.
- The Data Team will:
4. Implementing the strategy above should result in:
- company growth of size XL,
- over the next 6 months,
- with a deadline of 1 week.
5. We collaborated with Irene 6 months ago and couldn’t answer this question. We didn’t know which features were associated with the free vs. paid tiers – or when the upgrades happened. The Engineering team set up the data capture for this earlier this month.
Because requests by different collaborators may seem to ask for different things even when they have the same goals, by using this template, we’ll be able to uncover that. The template will help us conclude, that a vague request for:
- Customer lifetime value calculation, or
- Clustering, or
- Understanding feature usage or upgrades, or
- Look-a-like models,
really wants us to reduce the churn of the newly upgraded “pro” tier customers.
It’s also possible that while the request may look the same, the goals may be different! That is, the template may help us conclude that, instead, a vague request for:
- Customer lifetime value calculation, or
- Clustering, or
- Understanding feature usage or upgrades, or
- Look-a-like models;
is actually a request for help with upsells, and not a request for help in reducing churn.
Had we not used this template, we would’ve wasted time:
- calculating revenue from every single customer that’s ever bought our product, then
- getting seemingly endless requests for drill-downs,
- and then the collaborator wouldn’t even use the findings – after we’ve spent months putting everything together, leaving everyone frustrated.
With the help of this framework, we’ll be able to uncover the differences and nuances of the request. Writing out the shared understanding for each request will also show us when we’re all not on the same page yet. Onboarding any future collaborators and making handoffs within and between teams will be easier. We’ll also all have a better idea about what tables to create/pull – before any work starts, delivering impactful data products that save us valuable time.
Advice for Implementing Framework in Practice
At first, the framework seems like overkill. Still, with practice, it will help demonstrate to our collaborators that we’re all on the same team, working together toward the same objectives and end goals. Armed with this knowledge, we’ll be able to deliver actionable results faster.
One way to get started using this template to uncover business questions throughout the company is to do a gradual roll-out, with a mini-retrospective each time we complete the template (evaluating what’s working and not and what can be improved), adapting the template each time to the company and team needs.
What that can look like in practice:
- First, take the lead in completing this template with the next request; on the following request, partner with a trusted collaborator to fill in the blanks together.
- Then, have a few trusted colleagues practice taking the lead in completing the templates on their next few requests; then, on the requests after that, have the colleagues engage a few trusted collaborators to fill in the template together.
- Have a larger subset of team members/collaborators complete the template together; then, ask a handful of collaborators with prior template experience to complete the intake form themselves on the next set of requests.
The goal is to continue rolling out this new intake process to larger and larger subsets of the company as the new Data Team’s process for handling requests, adapting the template based on retrospectives and feedback every time, and ultimately ending up with the template, that works for the Data Team and across the company, and becomes a part of the project management software (or similar), to help the team scale, become more strategic, and have more impact.
It may take at least 6 months for requests from each of the collaborators to go from “what’s the LTV of our customers?” to “here’s what we’re trying to solve and where we need support,” and from “we need this by the end of the day” to “we’d like to know this within the next month, in preparation for the next quarterly board meeting.”
Expect some pushback while rolling out the template as the new process. One way to get buy-in from executives and other collaborators is that this framework will help the team focus on the highest priority, highest impact requests above everything else – and keeping track of requests will inform the future strategy and roadmap of the company and the team. What that means for the team is, ideally, a more manageable workload. To get more buy-in on this framework across the board, consider holding office hours (or similar, if none exist) to help others with quick questions (that take less than an hour to address, from start to finish). Don’t forget to complete the template for these requests as well!
Developing the Next Actionable Data Product
The key to a successful data product is really understanding the business question before we implement anything – and managing expectations about the collaboration.
We can begin today by understanding how we bring value to our customers and the company by uncovering the context behind the request to identify the outcomes, objectives, and strategy, to provide actionable recommendations to our collaborator. These will tie into how the deliverable will plug into existing customer habits of product/service usage to help our customers get more value and grow into a bigger, more loyal, and profitable customer base. This strategy should move the needle on a key metric! It just happens to involve data, infrastructure, pipelines, or ML/AI.
Once the mission statement template is complete and the highest-impact request gets prioritized – we’re ready to start development (!), because now we know what the end goal for the data product deliverable looks like. It will “driv[e] the company forward”, improve the team and company’s product-market fit, help the data team scale, and get us more visibility and recognition!
Thoughts? Comments? Please let me know by joining our Slack community!
Acknowledgments
The template has seen many iterations since 2019, when I first began leading large Data teams and teaching graduate students about developing data product MVPs for production. I hope the template helps you grow in your career!
Similar to data products, this article couldn’t happen in a vacuum. I appreciate all the support from the community and the Locally Optimistic editorial board for helping me clarify and polish this article’s key points and takeaways. These individuals include (in alphabetical order): Neal Fultz, Dylan Gregersen, Michael Kaminsky, Łukasz Korecki, Ilan Man, Caitlin Moorman, Emilie Schario, and Sylvia Tran. Thank you!
Thank you to Josh Richman for suggesting the title for the original talk that inspired this article. Thank you to Margarita Fomenko for the illustration.
- 1I’ll avoid calling our collaborators stakeholders, following Johanna Rothman’s convention, and assume that our company is for-profit. Three resources on the topic of stakeholder management are my blog post on the “`Dark Arts’ of Stakeholder Management,” Jerrie and Niko’s advice on “Stakeholder Engagement Best Practices,” and the book on navigating difficult conversations.
- 2We can treat this template in one of 3 ways: (1) as a mental model for ourselves; (2) as a template to fill out as we meet with the collaborator; (3) as part of an intake form for the collaborator to fill out, because if they’re too busy to fill out the template, then the request isn’t a high priority. As a side effect, by filling out this template for every request (even if we DIY), we’ll be able to keep track of needs across the company, which may help inform future strategy.
- 3The template can also help us navigate the discussions around scope, because it will help us uncover what’s most important to the collaborator, e.g., which 2 of the “project management triangle” sides are most important? Do they need the deliverable to be full-featured or a proof-of-concept, fast or very accurate, or all hands on deck vs. staffed when the bandwidth becomes available? Discussing that the answer affects the priority of the request and that a deliverable scoped down to a proof-of-concept (e.g., the smallest experiment to learn from) will help us more quickly learn about our customers, iterate, and get on the same page – also helps with buy-in.
- 4Internal customers are collaborators inside the company, such as employees on another team (e.g., Marketing customers when we’re on the Data Team, or the Data Analytics Team when we’re on a Data Engineering Team); external customers are those that are outside the company, such as customers paying for the company’s products/services.
- 5Companies that bring customer value in more ways than one tend to have more customer loyalty.
- 6A goal shared with our collaborator means that we’re one team, working together on this request towards the same objective, and we succeed as a team only if we can partner to get there. Having shared goals also helps when having difficult conversations.
- 7Because customers’ preferences may change, there may be a bug in the data collection, or something else may happen when our data product goes live, we can never guarantee the plan’s performance.
- 8The number of lines/levers can vary depending on the company’s offering and pricing structure. For instance, companies that are (1) marketplaces can have one chart to summarize the demand and another for the supply, to help optimize customer journeys for each of these two different sets of customers; (2) products or services with hardware components can have an additional chart capturing the hardware supply chain, to help evaluate if there are things to optimize there; (3) hiring can adapt this chart to summarize and improve each step of the pipeline: from candidate sourcing to internal referrals, to hiring, onboarding, and retention.
- 9One side effect of using this chart is that it should cut down on the number of circular requests we’ll get, because we’ll have more clarity around what end goals we’re striving for, even if nothing else is clear. Another side effect is that it can help us reframe an unsupervised problem into a supervised problem, making it much easier to validate.
- 10Don’t forget to offer to discuss the context of how we’ve reached the suggestion(s) to help guide collaborators in their decision-making process.
- 11For example, potential metrics to summarize the expansion of low-valued users into high-valued users (line 6) can include: the additional profit from the expansion, the percentage of those that convert, the average time it takes for those that convert to do so, or the average time it takes to get back the customer acquisition costs (CAC) for those that convert.
- 12If we get started calculating the metric, but find that the data is missing or the quality poor, this will motivate the discussion with our collaborator on what’s higher impact and priority than the current request that we can try instead.
- 13In discussions, we can ask the collaborator directly (“what they had in mind”) or indirectly (“if, for example, our metric will be ‘3’ – “what will it tell you? how do you see yourself using it?”) to get a better idea of what they’re looking for — and how that plugs into current customer workflows.
- 14To ensure that the right collaborators are involved, this may also be a great time to use the DACI decision-making framework to identify who’s the Driver, Approver, Contributor, and who needs to be Informed of the progress on this request.
- 15This is because the team’s roadmap (if it exists) gets the highest priority. Typically, it results from priorities negotiated and aligned across departments and with executive input. To help push back on a low-priority request: share the prioritized roadmap with the requester, mention that executives prioritized it across the company, and let them know that the request has been added to the backlog and is a candidate for next quarter’s prioritization.
- 16Asana has a great resource on how to get started on estimating and using t-shirt sizing.
- 17Consider asking the collaborator for these rough details and estimates to prevent the scenario of everyone filling in “XL” to inflate the priority of the request artificially.